• Home
  • News – Real Estate Ink
  • Search Homes For Sale
  • Selling A Home
    • Your Home’s Value
    • Preparing Your Home For Sale
    • Get A Cash Offer On Your Home
  • Meet Eric Lowry
  • Contact Us

LowryTeam.com Real Estate Trends Report – October 2011

October 19, 2011 by Eric Lowry Leave a Comment

LowryTeam.com Real Estate Trends Report – October 2011


Here is the newest edition of our LowryTeam.com Monthly Real Estate Trends Report. This report, published monthly, provides a look back at the last six months worth of real estate data for West Chester, Beckett Ridge and Liberty Township, Ohio. It is a local trends report and makes no attempt to draw overall conclusions or make predictions for the larger real estate market. In fact we believe that anyone that makes an attempt to predict future, national real estate market conditions or draws conclusions on recent historical data nationally is just out of touch with reality. There is no such thing as a national weather forecast and there is no such thing as a real estate one either. ALL real estate is local!

The source of our data is the Greater Cincinnati Multiple Listing Service. By seeking out and understanding the trends in our market place we are better able to forecast the upcoming market conditions and counsel our clients on pricing strategies to get their home sold for the highest possible price. Any thoughts and insight into what may occur in the future are solely our opinions and forecasts.

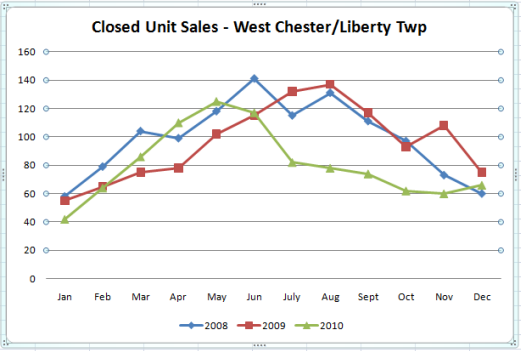
The first thing we look at is unit sales for the last six months (April – September):

Real Estate Sales For West Chester & Liberty Twp

A look at the sales numbers:

As we move into October and look back at this most recent six months of data, the trend that we are watching for right now is to see how unit sales will play out in the 4th quarter of the year. The 4th quarter sales last year (2010) were extremely weak, so we expect to see home sales continue to show improvement when compared to 2010. Sales in July thru September of 2011 have shown significant increases over the sales numbers for July thru September of 2010. The sales in July 2010 really dropped off after the expiration of the Homebuyer Tax Credits that were in place last year.

As of the end of September, the year to date sales for 2011 are very close to the same as the year to date sales for 2010 in West Chester & Liberty Township.  2011 year to date sales are down -1.66%

Average sale prices:

Average Sale Prices West Chester & Liberty Twp Real Estate

In this graph you can see the movement of the average sale price for West Chester and Liberty Township, Ohio real estate sales from January 2010 through September of 2011. The trend line continues to show you a decline for average home sale prices. Average sale price gets quite a bit of attention in the media with reports that quote “home prices fell” or “home prices rose” in this particular quarter or month or whatever. The average sale price is nothing more than what it’s called – an average price of all of the homes sold in a particular time frame.

Any increase or decrease in the average sale price is reflective of the activity of that time frame not the exact value of any one home. Falling home values do clearly effect the average sale price, but that is not the whole story. The mix of homes and their values definitely play a part in this fluctuation, ie., many more lower priced homes selling than in the luxury market.

List to sale price ratio:

Real Estate Sales For West Chester & Liberty Twp Percentage

The List to Sale Price ratio is calculated by dividing the final sale price into the list price to find the percentage of the list price that a given home sells for. The West Chester and Liberty Township Ohio List to Sale Price Ratio was 96.32% for September 2011. As you can see the monthly List to Sale Price Ratio has seen some big swings up and down in the last year. Overall the recent months list to sale price ratio seems to be fairly stable and on a slightly upward track. The highlighted center area of the graph shows what appears to be the middle ground right now for the market.

Summary:

As we have stated previously in the LowryTeam.com: West Chester, Beckett Ridge and Liberty Township real estate market update, our market remains challenging, yet full of opportunity. Clearly the value of homes in West Chester, Beckett Ridge & Liberty Twp has fallen over the past couple of years and frankly, the values may still fall farther. The primary threats or obstacles to the final quarter of 2011 real estate market and any potential recovery are continued high unemployment, a considerable oversupply of homes for sale and the potential loss of the mortgage interest tax deduction. Interest rates have settled back down and are at historical low levels around 4.25% which provide a great environment for buying a new home.

Wondering what the value of your home currently is? We would be happy to provide you with a detailed market value analysis of the value of your home. You can request your Market Value Analysis here

Other related posts you may be interested in:

What Are Mortgage Interest Rates In West Chester & Liberty Township OH?

Top 10 Tips When Selling a Home In West Chester, Liberty Twp Or Mason Ohio

Your comments and questions are always welcome!

    Your Name (required)

    Your Email (required)

    Subject

    Phone

    Your Message

    Filed Under: Eric Lowry's Articles, LowryTeam.com Real Estate Market Trends Report Tagged With: Beckett Ridge Real Estate, Eric Lowry, Home Prices, Home Sales, Home Values, Housing Market, Housing Statistics, Keller Williams Realty, Liberty Township Real Estate, LowryTeam.com, Market Trends Report, Real Estate Market Breakdown, Real Estate Market Reports, VIPHomeFinder.com, West Chester Ohio Real Estate

    LowryTeam.com Real Estate Trends Report – August 2011

    August 23, 2011 by Eric Lowry Leave a Comment

    Here is the newest edition of our LowryTeam.com Monthly Real Estate Trends Report covering sales for July 2011. This report, published monthly, provides a look back at the last six months worth of real estate data for West Chester, Beckett Ridgeand Liberty Township, Ohio. It is a local trends report and makes no attempt to draw overall conclusions or make predictions for the larger real estate market. In fact we believe that anyone that makes an attempt to predict future, national real estate market conditions or draws conclusions on recent historical data nationally is just out of touch with reality. There is no such thing as a national weather forecast and there is no such thing as a real estate one either. ALL real estate is local!

    The source of our data is the Greater Cincinnati Multiple Listing Service. By seeking out and understanding the trends in our market place we are better able to forecast the upcoming market conditions and counsel our clients on pricing strategies to get their home sold for the highest possible price. Any thoughts and insight into what may occur in the future are solely our opinions and forecasts.

    The first thing we look at is unit sales for the last six months (February – July):

    West Chester & Liberty Twp OH Real Estate Sales

    It’s all about the sales numbers right now:

    As we move towards the end of August and look back at this most recent six months of data, the trend that we are watching for right now is to see if there will be a continued softening in unit sales as we saw in 2010. The graph for this year’s sales show very little of what we typically call the spring market. Sales in July of 2011 finally were up over the sales numbers for July of 2010. The sales in July 2010 really dropped off after the expiration of the Homebuyer Tax Credits that were in place last year.  These tax credits had really propped up the home sales in the first half of 2010.

    Everyone was excited to see the increase of unit sales over the same month in the previous year.  This was the first time we had seen this happen since January.  What does this really mean though?  First, based on the very low comparisions for the rest of the year vs. 2010, this is a trend that we are likely to see continue for a number of months in a row.  And secondly, a look at how these July sales numbers stacked up against the July sales numbers for previous years is perhaps a better place to draw some perspective.

    West Chester & Liberty Township Ohio Real Estate Sales

    While the sales figures for July (2011 vs 2010) were up, the July 2011 sales were the second lowest in the past decade for the West Chester & Liberty Township Ohio real estate market for the month of July.

    When considering the health of the housing market, everything hinges right now on home sales. Home prices will not be able to show any stability in the foreseeable future with the amount of inventory (homes for sale) that we currently have on the market vs. the number of homes that are actually selling. We have a large oversupply of homes for sale in West Chester and Liberty Township and this only puts further pressure on listing and sale prices. We believe that home values will continue to fall. For homeowners needing to sell, the best chance to get the highest price for their home is to get the home sold in the very near term. It truly is all about the home sales numbers right now!

    Average sale price for the last six months (February – July) is next:

    West Chester & Liberty Twp Avg Sales Price

    In this graph you can see the movement of the average sale price for West Chester and Liberty Township, Ohio real estate sales from January 2010 through July of 2011. The trend line continues to show you a gradual decline for average home sale prices. Average sale price gets quite a bit of attention in the media with reports that quote “home prices fell” or “home prices rose” in this particular quarter or month or whatever. The average sale price is nothing more than what it’s called – an average price of all of the homes sold in a particular time frame.

    However, just to be clear here, homes are not worth more now than they were at the beginning of the year. Any increase or decrease in the average sale price is reflective of the activity of that time frame not the exact value of any one home. Falling home values do clearly effect the average sale price, but that is not the whole story. The mix of homes and their values definitely play a part in this fluctuation, ie., many more lower priced homes selling than in the luxury market.

    List to sale price ratio:

    West Chester & Liberty Twp List To Sale Price Ratio

    The List to Sale Price ratio is calculated by dividing the final sale price into the list price to find the percentage of the list price that a given home sells for. The West Chester and Liberty Township Ohio List to Sale Price Ratio was 96.91% for July 2011. As you can see the monthly List to Sale Price Ratio has seen some big swings up and down in the last year. The swings up and down are an indicator of the lack of stability in the West Chester and Liberty Township real estate market right now. The highlighted center area of the graph shows what appears to be the middle ground right now for the market.

    Summary:

    As we have stated previously in the LowryTeam.com: West Chester, Beckett Ridge and Liberty Township real estate market update, our market remains challenging, yet full of opportunity. Clearly the value of homesin the area has fallen over the past couple of years and frankly, the values are likely to fall farther. The primary threats or obstacles to the second half of 2011 real estate market and any potential recovery are continued high unemployment, a considerable oversupply of homes for sale and the potential loss of the mortgage interest tax deduction. Interest rates have settled back down and are at historical low levels around 4.25% which provide a great environment for buying a new home.

    Wondering what the value of your home currently is?  We would be happy to provide you with a detailed market value analysis of the value of your home. You can request your Market Value Analysis here

    Your comments and questions are always welcome!

      Your Name (required)

      Your Email (required)

      Subject

      Phone

      Your Message

      Other related posts you may be interested in:

      What Are Mortgage Interest Rates In West Chester & Liberty Township OH?

      West Chester & Liberty Township OH Real Estate Market Breakdown – July 2011

      Filed Under: Eric Lowry's Articles, LowryTeam.com Real Estate Market Trends Report, Real Estate Information, Real Estate Market Reports Tagged With: Average Home Sale Prices In West Chester Ohio, Eric Lowry, Home Sales, Liberty Township Real Estate, LowryTeam.com, Market Trends Report, Ohio, Top Real Estate Agent, VIPHomeFinder.com, West Chester Real Estate

      LowryTeam.com Monthly Real Estate Trends Report – June 2011

      June 20, 2011 by Eric Lowry Leave a Comment

      West Chester OH Home Prices & Market UpdateHere is the newest edition of our LowryTeam.com Monthly Real Estate Trends Report for May 2011.  This report, published monthly, provides a look back at the last six months worth of real estate data for West Chester, Beckett Ridge and Liberty Township, Ohio.  It is a local trends report and makes no attempt to draw overall conclusions or make predictions for the larger real estate market.  In fact we believe that anyone that makes an attempt to predict future, national real estate market conditions or draws conclusions on recent historical data nationally is just out of touch with reality.  There is no such thing as a national weather forecast and there is no such thing as a real estate one either.  ALL real estate is local!

      The source of our data is the Greater Cincinnati Multiple Listing Service. By seeking out and understanding the trends in our market place we are better able to forecast the upcoming market conditions and counsel our clients on pricing strategies to get their home sold for the highest possible price. Any thoughts and insight into what may occur in the future are solely our opinions and forecasts.

      The first thing we look at is unit sales for the last six months (December – May):

      West Chester & Liberty Township Home Sales & Home Prices
      Click The Image To See A Larger Version


      It’s all about the sales numbers right now:

      As we move towards the end of June and look back at this most recent six months of data, the trend that we see is a continued softening in unit sales.  The graph shows very little of what we might have typically called the spring market.  Sales are down pretty dramatically when compared to the same months last year.  The reason for this is the Homebuyer Tax Credits that were in place last year, which really propped up the home sales in the first half of the year.

      May 2011 homes sales showed a very small uptick in sales when compared to the months of March and April 2011.  May 2011 sales were 35.16% lower than May of 2010.   So the year over year comparison of sales does not look good. Again, some of this is due to comparisons to the tax credit months, but home sales clearly remain at very low levels, with no visible signs of improvement in the near future.

      Everything hinges right now on home sales.  Home prices will not be able to show any stability in the foreseeable future with the amount of inventory (homes for sale) that we currently have on the market for sale vs. the number of homes that are actually selling.  We have a large oversupply of homes for sale in West Chester and Liberty Township and this only puts further pressure on listing and sale prices.  We believe that the home values will continue to fall.  For homeowners needing to sell, the best chance to get the highest price for their home is to get the home sold in the very near term.  It truly is all about the home sales numbers right now!

      Average sale price for the last six months (December – May) is next:

      West Chester & Liberty Township Ohio Home Prices
      Click The Image To See A Larger Version


      In this graph you can see the movement of the average sale price for West Chester and Liberty Township, Ohio real estate sales from January 2010 through May of 2011.  The trend line continues to show you a gradual decline for average home sale prices.  Average sale price gets quite a bit of attention in the media with reports that quote “home prices fell” or “home prices rose” in this particular quarter or month or whatever.  The average sale price is nothing more than what it’s called – an average price of all of the homes sold in a particular time frame. 

      However, just to be clear here, homes are not worth more now than they were at the beginning of the year.  Any increase or decrease in the average sale price is reflective of the activity of that time frame not the exact value of any one home.  Falling home values do clearly effect the average sale price, but that is not the whole story.  The mix of homes and their values definitely play a part in this fluctuation, ie., many more lower priced homes selling than in the luxury market.

      List to sale price ratio: 

      West Chester & Liberty Township List to Sale Home Price Ratio
      Click The Image To See A Larger Version

      The List to Sale Price ratio is calculated by dividing the final sale price into the list price to find the percentage of the list price that a given home sells for.  The West Chester and Liberty Township Ohio List to Sale Price Ratio is 95.66% for May 2011.  As you can see the monthly List to Sale Price Ratio has seen some big swings up and down in the last year and we took another big drop down in February.  The swings up and down are an indicator of the lack of stability in the West Chester and Liberty Township real estate market right now.  The highlighted center area of the graph shows what appears to be the middle ground right now for the market. 

      The trend here had been on an upswing, indicating that homeowners are generally pricing their homes at levels that reflect market value.  One important fact to keep in mind here is that these figures are calculated based on homes that have sold.  Homes that are priced too high when listed will not get 95-96% of their list price, in fact in this market, they won’t sell at all. 

      Summary:

      As we have stated previously in the LowryTeam.com: West Chester, Beckett Ridge and Liberty Township real estate market update, our market remains challenging, yet full of opportunity. Clearly the value of homes in the area has fallen over the past couple of years and frankly, the values are likely to fall farther.  The primary threats or obstacles to the second half of 2011 real estate market and any potential recovery are continued high unemployment, a considerable oversupply of homes for sale and the potential loss of the mortgage interest tax deduction.  Interest rates have settled back down and remain at very attractive levels around 4.5 – 4.75% which provide a great environment for buying a new home.

      Your comments and questions are always welcome!

      Filed Under: Eric Lowry's Articles, LowryTeam.com Real Estate Market Trends Report, Market Update, Real Estate Market Reports Tagged With: Beckett Ridge Realtor, Cincinnati, Eric Lowry, Home Prices, Home Values, Keller Williams Realty, Liberty Township Real Estate, LowryTeam.com, Market Trends Report, Ohio, Top Real Estate Agent, Top Selling Realtor, VIPHomeFinder.com, West Chester Ohio Real Estate

      LowryTeam.com: Monthly Real Estate Trends Report – March 2011

      March 30, 2011 by Eric Lowry Leave a Comment

      LowryTeam.com Real Estate Market Trends Report For West Chester & Liberty TownshipHere is the newest edition of our LowryTeam.com Monthly Real Estate Trends Report for March 2011.  This report, published monthly, provides a look back at the last six months worth of real estate data for West Chester, Beckett Ridge and Liberty Township, Ohio.  It is a local trends report and makes no attempt to draw overall conclusions or make predictions for the larger real estate market.  In fact we believe that anyone that makes an attempt to predict future, national real estate market conditions or draws conclusions on recent historical data nationally is just out of touch with reality.  There is no such thing as a national weather forecast and there is no such thing as a real estate one either.  ALL real estate is local!

      The source of our data is the Greater Cincinnati Multiple Listing Service. By seeking out and understanding the trends in our market place we are better able to forecast the upcoming market conditions and counsel our clients on pricing strategies to get their home sold for the highest possible price. Any thoughts and insight into what may occur in the future are solely our opinions and forecasts.

      The first thing we look at is unit sales for the last six months (September – February):

      As mentioned in the February Real Estate Market Trends Report this most recent six months of data continues to reflect the decline in unit sales felt in the time immediately after the homebuyer tax credit expiration. The tax credit had the impact of drawing a lot of home sales into the first six months of last year and caused an extensive slow down afterward. The graph shows that the leveling off of home sales in West Chester and Liberty Township during this last six months time frame continued in February.

      February 2011 homes sales showed a small uptick in sales when compared to the month of January 2011.  February sales were however 9.38% lower than February of 2010.   So the year over year comparison of sales does not look promising, particularly as we head into the next couple of months which will be compared to the “tax credit” months of last year. 

      The next few months represent very tough comparisons moving forward as we will be comparing sales levels this year against the sales levels of the months of last year when the tax credits for homebuying were in place.  Generally we expect the year to year comparisons to be much lower than 2010 unless there is some unexpected development in the marketplace.

      Average sale price for the last six months (September – February) is next:

      In this graph you can see the movement of the average sale price for West Chester and Liberty Township, Ohio real estate sales from January 2010 through February of 2011.  The trend line continues to show you a gradual decline for average home sale prices.  Average sale price gets quite a bit of attention in the media with reports that quote “home prices fell” or “home prices rose” in this particular quarter or month or whatever.  The average sale price is nothing more than what it’s called – an average price of all of the homes sold in a particular time frame. 

      Track Home Sales In Your West Chester or Liberty Township Ohio Neighborhood Here >> Get Your Personal Market Snapshot!

      Just to be clear here, homes are not worth more now than they were at the beginning of the year.  Any increase or decrease in the average sale price is reflective of the activity of that time frame not the exact value of any one home.  A perfect example of this is the month of January which according to the graph shows a huge decrease in the average sale price over the month of January 2010.  A look inside the numbers explains… In January 2010, 8 of the total 42 closed sales that month were under $150,000 in sale price, in January 2011 there were 14 of a total 49 closed sales in that same price range.  More sales in the lower price ranges will cause the average sale price to be lower.  In addition, in January 2010  there were 6 closed sales over $400,000 compared to just 3 closed sales in January 2011 over $400,000.  The luxury home market is facing a very difficult period in the next six months to a year with very high inventory levels and competition from the Homearama show homes.

      So, was the average sale price lower because homes were worth less?  No, there was just a very different mix of homes that sold.  Falling home values do clearly effect the average sale price, but that is not the whole story.

      List to sale price ratio: 

      The List to Sale Price ratio is calculated by dividing the final sale price into the list price to find the percentage of the list price that a given home sells for.  The West Chester and Liberty Township Ohio List to Sale Price Ratio is 94.02% for February 2011.  As you can see the monthly List to Sale Price Ratio has seen some big swings up and down in the last year and we took another big drop down in February.  The swings up and down are an indicator of the lack of stability in the West Chester and Liberty Township real estate market right now.  The highlighted center area of the graph shows what appears to be the middle ground right now for the market. 

      The trend here had been on an upswing, indicating that homeowners are generally pricing their homes at levels that reflect market value.  One important fact to keep in mind here is that these figures are calculated based on homes that have sold.  Homes that are priced too high when listed will not get 95-96% of their list price, in fact in this market, they won’t sell at all. 

      The one factor that remains true, through all of the market’s ups and downs is that homes that sell quickly, sell for a much higher percentage of their list price.  In the most recent six months, homes that sold in the first thirty days that they were on the market sold for 96.75% of list price.  As you can see, this is a much higher final sales price compared to the overall market average.

      Summary:

      As was stated in last month’s LowryTeam.com: West Chester, Beckett Ridge and Liberty Township real estate market update, our market remains challenging, yet full of opportunity. Clearly the value of homes in the area has fallen over the past couple of years and frankly, in certain price ranges, the values are likely to fall farther.  The primary threats to the 2011 real estate market and any potential recovery are continued high unemployment and the potential loss of the mortgage interest tax deduction.  Interest rates have now risen off of their lows, but still remain at very attractive levels below 5.00% which provide a great environment for buying a new home.

      Your comments and questions are always welcome!

      Search Homes For Sale In West Chester & Liberty Township Ohio

      Wondering what your home is worth in today’s real estate market?  Request a market analysis here!

      posted by Eric Lowry

      Filed Under: Eric Lowry's Articles, LowryTeam.com Real Estate Market Trends Report, Market Update, Real Estate Information, Real Estate Market Reports, Real Estate Market Statistics, Real Estate News Tagged With: Average Home Sale Prices In West Chester Ohio, Beckett Ridge Real Estate, Cincinnati, Eric Lowry, Home Values, Housing Market, Keller Williams Realty, Liberty Township Real Estate, LowryTeam.com, Ohio, Real Estate Market, Real Estate Market Expert, Real Estate Market Reports, Real Estate Market Statistics, Realtor, Search Homes For Sale, Search The MLS, VIPHomeFinder.com, West Chester Real Estate

      LowryTeam.com: Monthly Real Estate Trends Report – February 2011

      March 2, 2011 by Eric Lowry Leave a Comment

      Here is the newest edition of our LowryTeam.com Monthly Real Estate Trends Report for January 2011.  This report, published monthly, provides a look back at the last six months worth of real estate data for West Chester, Beckett Ridge and Liberty Township, Ohio.  It is a local trends report and makes no attempt to draw overall conclusions or make predictions for the larger real estate market.  In fact we believe that anyone that makes an attempt to predict future, national real estate market conditions or draws conclusions on recent historical data nationally is just out of touch with reality.  There is no such thing as a national weather forecast and there is no such thing as a real estate one either.  ALL real estate is local!

      The source of our data is the Greater Cincinnati Multiple Listing Service. By seeking out and understanding the trends in our market place we are better able to forecast the upcoming market conditions and counsel our clients on pricing strategies to get their home sold for the highest possible price. Any thoughts and insight into what may occur in the future are solely our opinions and forecasts.

      We always look first at unit sales for the last six months (August – January):

      As mentioned in the January Real Estate Market Trends Report this most recent six months of data continues to reflect the time immediately after the homebuyer tax credit expiration.  As we discussed before there was a drop in sales in this period that was pretty dramatic.  The tax credit had the impact of drawing a lot of home sales into the first six months of the year and causing an extensive slow down afterward.  The graph shows that that there has been a leveling off of  home sales in West Chester and Liberty Township during this last six months timeframe. 

      January 2011 homes sales showed a continued decline when compared to the month of December and overall as you look at the last six months sales activity.  January sales were however 16.67% higher than January of 2010.   So in a year over year comparison the sales may look a little more promising.  It must be noted here that the sales figures in January 2010 were the lowest in West Chester & Liberty Township in at least the last five years, so this January’s sales are the second lowest in the last five years.


      The next few months represent very tough comparisons moving forward as we will be comparing sales levels this year against the sales levels of the “Tax Credit” months of last year.  Generally we expect the year to year comparisons to be much lower than 2010 unless there is some unexpected development in the marketplace.

      Average sale price for the last six months (August – January) is next:

      In this graph you can see the movement of the average sale price for West Chester and Liberty Township, Ohio real estate sales in 2010 and January of 2011.  The trend line continues to show you a gradual decline for average home sale prices.  Average sale price gets quite a bit of attention in the media with reports that quote “home prices fell” or “home prices rose” in this particular quarter or month or whatever.  The average sale price is nothing more than what it’s called – an average price of all of the homes sold in a particular time frame. 

      Track Home Sales In Your West Chester or Liberty Township Ohio Neighborhood Here >> Get Your Personal Market Snapshot!

      Just to be clear here, homes are not worth more now than they were at the beginning of the year.  Any increase or decrease in the average sale price is reflective of the activity of that time frame not the exact value of any one home.  A perfect example of this is the month of January which according to the graph shows a huge decrease in the average sale price over the month of January 2010.  A look inside the numbers explains… In January 2010, 8 of the total 42 closed sales that month were under $150,000 in sale price, in January 2011 there were 14 of a total 49 closed sales in that same price range.  More sales in the lower price ranges will cause the average sale price to be lower.  In addition, in January 2010  there were 6 closed sales over $400,000 compared to just 3 closed sales in January 2011 over $400,000.  The luxury home market is facing a very difficult period in the next six months to a year with very high inventory levels and competition from the Homearama show homes.

      So, was the average sale price lower because homes were worth less?  No, there was just a very different mix of homes that sold.  Falling home values do clearly effect the average sale price, but that is not the whole story.

      List to sale price ratio: 

      The List to Sale Price ratio is calculated by dividing the final sale price into the list price to find the percentage of the list price that a given home sells for.  The West Chester and Liberty Township Ohio List to Sale Price Ratio is 95.73% for January 2011.  As you can see the monthly List to Sale Price Ratio has seen some big swings up and down in the last year.  The swings up and down are an indicator of the lack of stability in the West Chester and Liberty Township real estate market right now.  The highlighted center area of the graph shows what appears to be the middle ground right now for the market.  The trend here is on an upswing, indicating that homeowners are generally pricing their homes at levels that reflect market value.  One important fact to keep in mind here is that these figures are calculated based on homes that have sold.  Homes that are priced to high when listed will not get 95-96% of their list price, in fact in this market, they won’t sell at all. 

      The one factor that remains true, through all of the market’s ups and downs is that homes that sell quickly, sell for a much higher percentage of their list price.  In the most recent six months, homes that sold in the first thirty days that they were on the market sold for 96.76% of list price.  As you can see, this is a much higher final sales price compared to the overall market average.

      Summary:

      As was stated in last month’s LowryTeam.com: West Chester, Beckett Ridge and Liberty Township real estate market update, the market remains challenging, yet full of opportunity. Clearly the value of homes in the area has fallen over the past couple of years and frankly, in certain price ranges, the values are likely to fall farther.  The primary threats to the 2011 real estate market and any potential recovery are continued high unemployment and the potential loss of the mortgage interest tax deduction.  Interest rates have now risen off of their lows, but still remain at very attractive levels below 5.00% which provide a great environment for buying a new home.

      Your comments and questions are always welcome! Search Homes For Sale In West Chester & Liberty Township Ohio Wondering what your home is worth in today’s real estate market?  Request a market analysis here!

      Filed Under: Eric Lowry's Articles, LowryTeam.com Real Estate Market Trends Report, Market Update, Real Estate Information, Real Estate Market Reports, Real Estate Market Statistics, Real Estate News Tagged With: Beckett Ridge Real Estate, Cincinnati, Eric Lowry, Eric's Hassle Free Listing, Home Sales, Homes For Sale, Keller Williams Realty, Liberty Township Real Estate, LowryTeam.com, Ohio, Real Estate Market Expert, Real Estate Market Reports, Real Estate Market Statistics, Top Real Estate Agent, Top Selling Realtor, VIPHomeFinder.com, West Chester Homes For Sale, West Chester Real Estate

      • « Previous Page
      • 1
      • 2
      • 3

      Search Thousands Of Homes For Sale In The MLS!

      Search_Widget

      Categories

      • Avoiding Foreclosure
      • Beckett Ridge Homes For Sale
      • Blue Ash Ohio Homes For Sale
      • Butler County Real Estate
      • Buyers
      • Cincinnati Real Estate Careers
      • Dayton Ohio Real Estate
      • Eric Lowry's Articles
      • Fairfield Community Information
      • Fairfield Homes For Sale
      • Fairfield Ohio Real Estate Market Reports
      • Fairfield Township Homes For Sale
      • Featured Properties
      • Featured Subdivision
      • Financing
      • Financing Options
      • First-time Homebuyer
      • Foto Friday
      • Holidays
      • Home Improvements
      • Homes For Sale in Lakota Schools
      • Just For Fun
      • Lebanon Ohio Homes For Sale
      • Liberty Township OH Real Estate Market Reports
      • Liberty Township Ohio Homes For Sale
      • Liberty Twp Community Info
      • Loveland Ohio Homes For Sale
      • LowryTeam.com Real Estate Market Trends Report
      • Maineville Ohio Homes For Sale
      • Market Update
      • Mason Community Information
      • Mason OH Real Estate Market Reports
      • Mason Ohio Homes For Sale
      • Monroe Homes For Sale
      • New Construction
      • New Listings
      • Preparing Your Home For Sale
      • Real Estate Information
      • Real Estate Market Reports
      • Real Estate Market Statistics
      • Real Estate News
      • Real Estate Video
      • Relocating to Cincinnati
      • Rent vs Buy
      • Restaurants & Dining
      • Sellers
      • Short Sale / Foreclosure
      • Springfield Ohio Real Estate
      • Tax Credit
      • Testimonials
      • Things To Do In Cincinnati Ohio
      • Things to do in Dayton
      • This Month In Real Estate
      • Tuesday Open House
      • West Chester Community Info
      • West Chester OH Real Estate Market Reports
      • West Chester Ohio Homes For Sale
      • West Chester Ohio Parks
      • What's My Home Worth
      • Wyoming Community Info
      Return To Top
      2025 Lowry Team Real Estate, Inc