• Home
  • News – Real Estate Ink
  • Search Homes For Sale
  • Selling A Home
    • Your Home’s Value
    • Preparing Your Home For Sale
    • Get A Cash Offer On Your Home
  • Meet Eric Lowry
  • Contact Us

West Chester & Liberty Township OH Real Estate Market Breakdown – July 2011

July 6, 2011 by Eric Lowry Leave a Comment

West Chester & Liberty Township OH Real Estate Market Breakdown – July 2011

Find Your Home's Current Market Value - West Chester & Liberty Twp OHIt’s time to breakdown the West Chester & Liberty Township Ohio real estate market again.  In the real estate market breakdown we take a look at which price ranges are in the best shape from a home sellers perspective in West Chester Ohio and Liberty Township, Ohio and which are not? The best way to measure the general strength of the West Chester & Liberty Township, Ohio real estate market and to break down it’s different price ranges is to evaluate the amount of homes for sale in both the total area and also in each different price range.

SEARCH ALL HOMES FOR SALE IN WEST CHESTER & LIBERTY TOWNSHIP, OHIO

As you can see in the chart below, there is clearly more activity in some price ranges than others and certainly more homes for sale in some of the ranges also. In each of the different price ranges you can see the number of homes for sale, the number of homes that have sold in the last six months and the months supply of homes for sale.

The number of homes for sale is a pretty straight forward statistic, the number of homes that have sold in the last six months is used to determine the rate that homes are currently selling. The key number in this chart is the months supply of homes for sale.

If we were in a seller’s market we would show a month’s supply of less than 5 months inventory, 5-6 months supply of homes for sale is considered a neutral market favoring neither homebuyers or homesellers and anything over 6 months is considered a buyer’s market. The higher the number of months of inventory the stronger the buyer’s market.

Clearly we can see that a number of price ranges are in a more extreme buyer’s market than others. It’s no surprise that we are in a buyer’s market, but the intensity of the buyer’s market in the higher price ranges is quite extreme.  When listing a home for sale you must understand the level of pricing pressure and competition so that you employ the correct pricing strategy in selling your home.
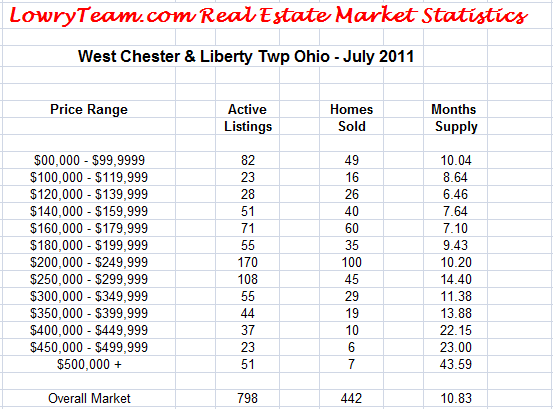
LowryTeam.com Real Estate Market Statistics July 2011
Click The Image To See A Larger Version

Please keep in mind that these statistics are for West Chester Ohio and Liberty Township, Ohio only and are based on data obtained from the Greater Cincinnati MLS.  When making pricing decisions and putting your home on the market be sure that you have not only looked at the recently sold homes in your neighborhood, but also at the active competition currently on the market and the direction of the current market.  Especially in your home’s particular price range.

Do you want to track the real estate market activity in your West Chester or Liberty Township Ohio neighborhood?  Get a free, comprehensive real estate market report sent directly to your inbox at >> Home Values In West Chester Ohio.

Filed Under: Eric Lowry's Articles, Market Update, Real Estate Market Reports, Real Estate Market Statistics, Real Estate News, Sellers Tagged With: Cincinnati, Eric Lowry, Homes For Sale, Liberty Township Housing Statistics, Liberty Township Real Estate, LowryTeam.com, Market Value Of My Home, Ohio, Real Estate Market, Real Estate Market Breakdown, VIPHomeFinder.com, West Chester House Statistics, West Chester Real Estate

West Chester & Liberty Township, Ohio Real Estate Market Update

March 28, 2009 by Eric Lowry Leave a Comment

February 2009 home sales compared to February 2008 for West Chester and Liberty Township, Ohio

In February 2008 79 units were sold vs. 65 units in February 2009.  This represents a decrease of 17.72%.  That is quite a drop in closed sales when compared to the year ago period.  Unit sales continue to be soft, with the overall economy and job security issues having a big impact on potential buyers.  The 1st time homebuyers tax credit is influencing the activity in the under $225,000 market in a positive way.


2008 Units 2009 Units + or –
79 65 -17.72%

The average sale price for February 2009 was down 12.28% compared to the same period in 2008.  As you can see in the table below, the average sale price in February 2008 was $228,849 compared to $200,757 in 2009.  As I have said before, for there to be a stabilization of home prices and then at some point a return of appreciation, we will need to see a smaller supply of homes available for sale and also a lessening of the pricing pressure that is currently being applied by distressed property sales, such as bank owned homes and short sales.  In many of the price ranges there remains a significant oversupply of homes for sale.

2008 Avg Sale Price 2009 Avg Sale Price + or –
 $228,849 $200,757 -12.28%

Wondering about the value of your home in today’s market? Request a Free Market Analysis. Check Out My Feature Homes For Sale In West Chester and Liberty Township, Ohio

Filed Under: Real Estate Information, Real Estate Market Statistics Tagged With: Beckett Ridge, Beckett Ridge Realtor, Cincinnati, Eric Lowry, Liberty Township Housing Statistics, Ohio, Real Estate Market Statistics, Sibcy Cline Realtors, Top Real Estate Agent, Top Selling Realtor, West Chester House Statistics

1st Half 2008 Home Sales For West Chester & Liberty Township, Ohio

August 24, 2008 by Eric Lowry

1st Half 2008 Home Sales For West Chester & Liberty Township, Ohio


Jan-June 2007

Jan-June 2008

+ / –

Closed Units

692

607

-12.28%

Average Sale Price

$244,219

$229,711

-5.94%

Average Days On Market

82

84

+2.44%

Average List to Sale Price %

96.54%

95.79%

-.75%

 Sales were down for the 1st half of 2008 when compared to the 1st half of last year.  This should come as no surprise to anyone.  Everywhere you look and/or read the message is the same for the most part. (Some of the reports make things out to be worse than others). Unit sales (closings)  were down 12.28% in West Chester and Liberty Township. 

Does this mean that you won’t be able to sell your home if you need to?  It most certainly does not.  I am successfully selling homes each and every month of this year and some of them pretty quickly.  What all of this does mean is: (1.) you must prepare your home for the market (2.) you must price it properly and (3.) you need a strong marketing effort.

Average sale prices were down 5.94% for the 1st half of 2008 when compared to the same period in 2007. There is no way to paint this statistic in a good light.  This is a large decrease in the average sale price for West Chester and Liberty Township homes. Again, this emphasizes the need to price your home correctly in today’s market.  Thinking of selling?  Click here to learn the current market value of your West Chester and Liberty Township. Ohio home.

Interest rates continue to be very volatile.  In the last week I have seen rates move lower to 6.20% for a 30 year fixed rate mortgage from a recent high of 6.55%.  The rates are changing daily.  If you need a referral to a good lender with competitive rates and closing costs please let me know.  Mortgage rate locks can become crucial right now. Read this article in my August online newsletter.

Your questions and comments are always welcome!

Filed Under: Real Estate Information, Real Estate Market Statistics Tagged With: Cincinnati, Getting ready to sell, Home Values, Homes For Sale, Liberty Township Housing Statistics, Mortgages, Relocation, West Chester House Statistics, West Chester Realtor

January 2008 Home Sales For West Chester & Liberty Township, Ohio

February 10, 2008 by Eric Lowry

January 2008 Home Sales For West Chester & Liberty Township, Ohio


January 2007

January 2008

+ / –

Closed Units

82

58

-29.27%

Average Sale Price

$228,572

$219,688

-3.89%

Average Days On Market

78

70

-10.26%

Average List to Sale Price %

95.86%

95.10%

-.76%

In review…

The number of closed units fell by 29.27% which continues to show a weak market for home sales.  We are seeing sporadic increases of showing activity by buyers, however these showings are not resulting in increased sales as of yet.  This just re-inforces the need to price a home very competitively to get it sold.  There are homes selling,  as evidence by these homes which sold in 35 DAYS, 38 DAYS, 18 DAYS and 28 DAYS!

The average sale price was $219,688 in January.  As I have stated before this is probably the most over examined statistic in real estate today.  This month it does reflect a lower average sale price than what was seen in January of 2007.  It is 3.89% lower than 2007.  This is certainly not surprising.

The average days on market came down to an average of 70 days on market which is a huge improvement over the average of 102 days that we saw on the homes that closed in December and it is also lower than the average for January 2007.  This can be looked at as a positive sign, however it is based on the smallest sampling of sales that we have seen in some time and we do still have an increasing inventory of homes for sale.

The list price to sale price ratio was considerably lower again in January 2008 as compared to January 2007.  It fell .76 basis points from the prior year and .62 points when compared to December 2007.

For a bit of really good news…  we continue to look to mortgage rates which are hovering around 5.65% for a thirty year fixed rate mortgage.  These are unbelievable times to be buying a home!

As always I will continue to monitor these market numbers  for West Chester and Liberty Township Ohio and will share them as they become available.  Should you have particular questions about these numbers please let me know!

If you would like to learn the current market value of your home I would be happy to provide you with it.

I would love to hear your thoughts as well!

Filed Under: Financing, Real Estate Information, Real Estate Market Statistics Tagged With: Buying, Home Values, Homes, Liberty Township, Liberty Township Housing Statistics, Oh, Real Estate, Relocation, West Chester, West Chester House Statistics

Search Thousands Of Homes For Sale In The MLS!

Search_Widget

Categories

  • Avoiding Foreclosure
  • Beckett Ridge Homes For Sale
  • Blue Ash Ohio Homes For Sale
  • Butler County Real Estate
  • Buyers
  • Cincinnati Real Estate Careers
  • Dayton Ohio Real Estate
  • Eric Lowry's Articles
  • Fairfield Community Information
  • Fairfield Homes For Sale
  • Fairfield Ohio Real Estate Market Reports
  • Fairfield Township Homes For Sale
  • Featured Properties
  • Featured Subdivision
  • Financing
  • Financing Options
  • First-time Homebuyer
  • Foto Friday
  • Holidays
  • Home Improvements
  • Homes For Sale in Lakota Schools
  • Just For Fun
  • Lebanon Ohio Homes For Sale
  • Liberty Township OH Real Estate Market Reports
  • Liberty Township Ohio Homes For Sale
  • Liberty Twp Community Info
  • Loveland Ohio Homes For Sale
  • LowryTeam.com Real Estate Market Trends Report
  • Maineville Ohio Homes For Sale
  • Market Update
  • Mason Community Information
  • Mason OH Real Estate Market Reports
  • Mason Ohio Homes For Sale
  • Monroe Homes For Sale
  • New Construction
  • New Listings
  • Preparing Your Home For Sale
  • Real Estate Information
  • Real Estate Market Reports
  • Real Estate Market Statistics
  • Real Estate News
  • Real Estate Video
  • Relocating to Cincinnati
  • Rent vs Buy
  • Restaurants & Dining
  • Sellers
  • Short Sale / Foreclosure
  • Springfield Ohio Real Estate
  • Tax Credit
  • Testimonials
  • Things To Do In Cincinnati Ohio
  • Things to do in Dayton
  • This Month In Real Estate
  • Tuesday Open House
  • West Chester Community Info
  • West Chester OH Real Estate Market Reports
  • West Chester Ohio Homes For Sale
  • West Chester Ohio Parks
  • What's My Home Worth
  • Wyoming Community Info
Return To Top
2025 Lowry Team Real Estate, Inc