|
|
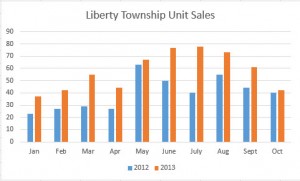
The LowryTeam.com Real Estate Trends Report for November 2013 for Liberty Township Ohio shows a dramatic gain in unit sales for the year when compared to the same time period of 2012. So far in 2013 there have been 576 homes and condos closed compared to 398 in 2013. This represents a gain of 44.72% in home sales. These closed sales numbers are for the time period of January 1st – October 31st. The chart below shows the breakdown month by month of the homes and condos closed.

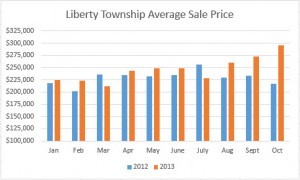
The LowryTeam.com Real Estate Trends Report for November 2013 for Liberty Township Ohio shows a fairly significant gain in the Average Sale Price of homes sold and closed in 2013 when compared to 2013. The chart below shows the breakdown by month of the Average Sale Price of homes in Liberty Township, Ohio.

 LowryTeam.com Real Estate Trends Report – March 2012 Home Sales West Chester & Liberty Twp. OH
The source of our data is the Greater Cincinnati Multiple Listing Service. By seeking out and understanding the trends in our market place we are better able to forecast the upcoming market conditions and counsel our clients on pricing strategies to get their home sold for the highest possible price. Any thoughts and insight into what may occur in the future are solely our opinions and forecasts.
This month we are breaking the data down into several different blog posts. This first article will cover home sales for the for the first three months of 2012 (January – March):
A close look at the home sales for West Chester & Liberty Township Ohio:
As we move into April and look back at the first three months of home sales for West Chester and Liberty Township, the trend that we are seeing right now is one that continues to support the belief that the housing market locally has stabilized in terms of home sales. The 1st quarter sales last year (2011) were weak, so our comparisons of the home sales figures continue to show improvement when compared to 2011. Sales in the first three months of 2012 have shown a significant, 10.80% increase over the home sales numbers for the first three months of 2011. While sales have shown a pretty nice uptick in this time frame, a little historical perspective is helpful in understanding where we are in the overall health of the real estate market. March 2012, while much improved over the previous few months, was the third lowest March home sales number we have seen since 2001. In fact the March 2012 home sales total was less than half of the total that was seen in March of 2005 and 2006.
As can be seen by the graph above we seem to be trending along a path very similar to 2010’s home sales. However, the months of April – June of 2010 were very much effected (inflated) by the homebuyer tax credit that was in place in 2010. Thus we are unlikely to stay on a track that will keep us even with 2010. The more likely senario we believe is that we will track along a path somewhere between the home sales of 2010 and 2011.
Summary:
As we have stated previously in the LowryTeam.com: West Chester, Beckett Ridge and Liberty Township real estate market update, the market remains challenging for home sellers and is full of opportunity for homebuyers. The real estate market in West Chester and Liberty Township has really become two distinctly different markets when you look at the differences in activity and levels of inventory for sale broken down by price range. We will take a look at this trend in our next article.
The primary threats or obstacles to the recovery of real estate market are continued high unemployment, a continued oversupply of homes for sale and the potential loss of the mortgage interest tax deduction. Interest rates continue to hover at the historical low levels of around 4.25%.
Wondering what the value of your home currently is? We would be happy to provide you with a detailed market value analysis of the value of your home. You can request your Market Value Analysis here
Other related posts you may be interested in:
Search West Chester Ohio Homes For Sale and Real Estate
Top 10 Tips When Selling a Home In West Chester, Liberty Twp Or Mason Ohio
Welcome to the Liberty Township Ohio homes for sale and real estate search engine, your single resource for finding a home in Liberty Township Ohio. With our real estate search engine you can search every available home for sale in Liberty Township. Some of the subdivisions that are located in Liberty Township include Four Bridges subdivision, The Trails Of Four Bridges, Welbourne Manor subdivision, Welbourne Farms subdivision, Cherokee Estates subdivision, Logsdons Ridge subdivision, Wynds of Liberty subdivision and many, many more.
At any given time there are many homes and some condos listed for sale in Liberty Township OH that are available for your online real estate search. New listings and price changes are updated to our site every day, so be sure to check back to see the latest listings for sale in Liberty Township Ohio.
Liberty Township Ohio Single Family Homes For Sale
Liberty Township Ohio Condos & Townhomes For Sale
Liberty Township Ohio Luxury Homes For Sale
In addition to being able to view all of the homes listed for sale in Liberty Township Ohio you can also access detailed information on the Liberty Township OH community, information on the Lakota school system and comprehensive information on home values and pricing trends for Liberty Township Ohio real estate.
Buy a home in Liberty Township Ohio with confidence. We know your home purchase is a big decision and that’s why we specialize in the Northern suburbs of Cincinnati like Liberty Township. We know these neighborhoods, where the schools are, how close the grocery stores and the daycare’s are.
Have a questions about the Liberty Township area? Ready to go see some homes? Contact us right now using the form below and we will respond back to you as quickly as we can!
West Chester & Liberty Township OH Real Estate Market Breakdown – July 2011
![]() It’s time to breakdown the West Chester & Liberty Township Ohio real estate market again. In the real estate market breakdown we take a look at which price ranges are in the best shape from a home sellers perspective in West Chester Ohio and Liberty Township, Ohio and which are not? The best way to measure the general strength of the West Chester & Liberty Township, Ohio real estate market and to break down it’s different price ranges is to evaluate the amount of homes for sale in both the total area and also in each different price range.
It’s time to breakdown the West Chester & Liberty Township Ohio real estate market again. In the real estate market breakdown we take a look at which price ranges are in the best shape from a home sellers perspective in West Chester Ohio and Liberty Township, Ohio and which are not? The best way to measure the general strength of the West Chester & Liberty Township, Ohio real estate market and to break down it’s different price ranges is to evaluate the amount of homes for sale in both the total area and also in each different price range.
SEARCH ALL HOMES FOR SALE IN WEST CHESTER & LIBERTY TOWNSHIP, OHIO
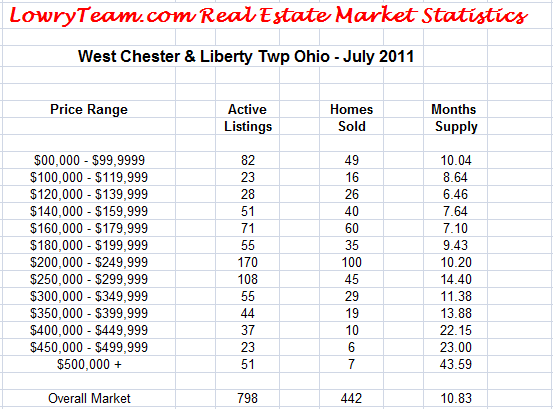
As you can see in the chart below, there is clearly more activity in some price ranges than others and certainly more homes for sale in some of the ranges also. In each of the different price ranges you can see the number of homes for sale, the number of homes that have sold in the last six months and the months supply of homes for sale.
The number of homes for sale is a pretty straight forward statistic, the number of homes that have sold in the last six months is used to determine the rate that homes are currently selling. The key number in this chart is the months supply of homes for sale.
If we were in a seller’s market we would show a month’s supply of less than 5 months inventory, 5-6 months supply of homes for sale is considered a neutral market favoring neither homebuyers or homesellers and anything over 6 months is considered a buyer’s market. The higher the number of months of inventory the stronger the buyer’s market.
Clearly we can see that a number of price ranges are in a more extreme buyer’s market than others. It’s no surprise that we are in a buyer’s market, but the intensity of the buyer’s market in the higher price ranges is quite extreme. When listing a home for sale you must understand the level of pricing pressure and competition so that you employ the correct pricing strategy in selling your home.

Please keep in mind that these statistics are for West Chester Ohio and Liberty Township, Ohio only and are based on data obtained from the Greater Cincinnati MLS. When making pricing decisions and putting your home on the market be sure that you have not only looked at the recently sold homes in your neighborhood, but also at the active competition currently on the market and the direction of the current market. Especially in your home’s particular price range.
Do you want to track the real estate market activity in your West Chester or Liberty Township Ohio neighborhood? Get a free, comprehensive real estate market report sent directly to your inbox at >> Home Values In West Chester Ohio.
by Eric Lowry
I am pleased to present my 1st Quarter 2010 Real Estate Market Report for West Chester, Beckett Ridge and Liberty Township, Ohio. In this report you will find detailed real estate information and statistics. The source of this information is the Greater Cincinnati Multiple Listing Service. By seeking out and understanding the trends in our market place we are better able to forecast the upcoming market conditions. Any thoughts and insight into what may occur in the future are solely my opinions and forecasts.
I am very focused on providing the best information possible and to being the real estate expert in our West Chester, Beckett Ridge & Liberty Township, Ohio area. Please let me know if you have any questions regarding any of this information. So let’s get started:
SALES:
There were 189 homes sold in the 1st Quarter of 2010 compared to 195 homes sold in the 1st Quarter of 2009. This represents a decrease of 3.08%. If you simply leave it at that, it doesn’t look too bad. However, if you dissect the market a little, you will see that things can look a little different depending on the price range. Also, we must keep in mind that in the 1st Quarter of 2010, sales with out question have been supported / propped up by the goverment’s tax credit incentives for both 1st time homebuyers and repeat buyers. We did not have these incentives in place in the 1st Quarter of 2009, thus one could surmise, pretty easily I think, that the percentage decrease would have been quite a bit larger if not for the tax credit incentives.
Below, you will see the sales broken down by price range, which paints a picture of several different markets within the West Chester and Liberty Township, Ohio real estate market:
| Price Range | 2010 Units | 2009 Units | + or – % |
| Less than $200,000 | 93 | 97 | -4.12% |
| $200,000 – $249,999 | 36 | 44 | -18.18% |
| $250,000 – $299,999 | 27 | 30 | -10.00% |
| $300,000 – $399,999 | 21 | 20 | -5.00% |
| $400,000 – $499,999 | 4 | 2 | 100% |
| $500, 000 + | 8 | 2 | 300% |
AVERAGE SALE PRICE:
The average sale price in the 1st Quarter of 2010 for the West Chester and Liberty Township Ohiomarkets was $223,139 compared to $207,772 in the 1st Quarter of 2009, which constitutes an increase of 7.40%. So, let’s talk about what this means and what it doesn’t mean. First, it does mean that the average price of all of the homes that sold was quite a bit higher, 7.02% higher in fact. However, what this doesn’t mean is that the value of our homes rose by 7.40% in this period. This average sale price is affected quite a bit in this case by the fact that we saw a pretty good increase of sales of higher priced homes compared to the market as a whole. This occurred while we had a decrease in the percentage of sales closed in all of the ranges under the $400,000 range, thus causing the average to be higher.
So, is this good news or bad news? Really to be honest, it is no news. To know the value of your home and just how much the value has fallen you need a detailed, analytical analysis of the current market value. You cannot draw a conclusion from market averages, and certainly not from what you read in the newspaper, Cincinnati Enquirer, USA Today or otherwise.
SUPPLY OF HOMES FOR SALE:
The oversupply of homes for sale is where the pricing pressure comes from. Too many homes for sale in relation to how many are selling is a critical indicator to monitor as we watch for signs of market stabilization. At the end of the 1st Quarter of 2010 we had 720 homes for sale in the West Chester, Beckett Ridge and Liberty Township, Ohio marketplace compared to 743 homes for sale in 2009. Meaning we have not seen a huge reduction in the amount of homes for sale. With a current inventory of 720 homes for sale, based on our current rate of sale we have just under 7.39 months worth of inventory for sale. Meaning if we continue to sell homes at the current pace and no new listings come on the market, it would take us just under 7.39 months to sell them all compared to a 7.75 month supply one year ago. So, relative to the pace that homes are selling, we have seen a small reduction in the inventory of homes for sale. However, just like unit sales, these numbers can vary greatly by price range as you can see below.
| PRICE RANGE | HOMES FOR SALE | MONTHS SUPPLY |
| Less than $200,000 | 299 | 6.42 |
| $200,000 – $249,999 | 140 | 6.46 |
| $250,000 – $299,999 | 80 | 6.49 |
| $300,000 – $399,999 | 98 | 9.19 |
| $400,000 – $499,999 | 49 | 14.00 |
| $500,000 + | 54 | 20.22 |
INTEREST RATES:
At the end of the 1st Quarter of 2010 interest rates on a 30 year fixed rate mortgage were hovering around a range of 4.95% – 5.05% which is largely the same as they were just one year ago. We have seen interest rates start to increase in the last few weeks though. Just two weeks ago that thirty year mortgage was right around 4.75%. So in the last two weeks rates have increased approx. .30%. This is still a very clear example of the extreme value of today’s interest rates.
TOP 10 SALES:
The top 10 sales of the 1st Quarter of 2010*:
| 1. 6694 Southampton Lane | West Chester | $833,900 |
| 2. 7347 Wetherington Drive | West Chester | $778,965 |
| 3. 7311 Tamarron Place | West Chester | $725,000 |
| 4. 6883 Harbour Town Drive | West Chester | $563,545 |
| 5. 7277 Southampton Lane | West Chester | $535,000 |
| 6. 7237 Clawson Court | West Chester | $529,900 |
| 7. 7286 Southampton Lane | West Chester | $529,900 |
| 8. 4200 Tylers Estate Drive | West Chester | $515,000 |
| 9. 5816 Ferdinand Drive | West Chester | $478,000 |
| 10. 6745 Cherry Laurel Drive | Liberty Twp. | $430,000 |
*These sales are not necessarily those of Eric Lowry and the Lowry Team.
Summary:
The West Chester, Beckett Ridge and Liberty Township real estate market remains challenging, yet full of opportunity. Clearly the value of homes in the area has fallen over the past couple of years and frankly, in certain price ranges, the values are likely to fall farther. I would expect in the market overall, for the rate of decline to slow, however, only when the supply of homes for sale drops and the number of buyers increases, will prices stabilize. It will take a number of years to return to the values that we once experienced. Exactly how long will be determined by the overall economy including the unemployment rate and of course how long interest rates are able to remain low. This is a great market to buy a home and is particularly good for 1st time home buyers. It is also very favorable for homeowners looking to move up to a larger home. Any loss experienced on the selling side should be more than made up for on the purchase side. Your comments and questions are always welcome! Wondering what your home is worth in today’s real estate market? Request a market analysis here!
Check Out My Feature Homes For Sale In West Chester, Fairfield and Liberty Township, Ohio