How long should your homebuying consultation with your Realtor last? Just what is a intial homebuying consultation? An initial homebuying consultation shouldn’t last more than 90 minutes and should clearly explain the homebuying process. To schedule a homebuying consultation visit our website here and meet our team! Click Here To Search The Entire Cincinnati MLS Database Of Homes For Sale! Wondering what your home is worth in today’s real estate market? Request a market analysis here!
West Chester & Liberty Township OH Real Estate: Tuesday Open House – April 5th, 2011
 It’s Tuesday, so this must be the Tuesday Open House.
What is Tuesday Open House?? Well, it’s clearly not an “open house”. Open Houses don’t sell homes… good internet marketing does… but it seemed like a good title for this weekly blog post.
It is my way of throwing the doors open on the RealEstate-Ink.com blog and offering up a few quick articles and facts on real estate for the West Chester, Liberty Township, Beckett Ridge, Mason and Fairfield Township, Ohio areas. It is not intended to be all about homes for sale, but it will be about that some of the time…

Need Mulch? If you are preparing your home to get it on the market for sale soon, don’t forget the curb appeal. As the old saying goes… you only get one chance to make a good first impression. So clean up the landscaping and get yourself some fresh mulch. I’m not sure that there is a better way to go than to get it from the boy scouts. They even deliver! You can just go directly to the boy scouts site right here. My mulch is being delivered in just a couple of weeks…anyone like to help??

Searching For Bank Owned or Short Sale Homes For Sale? You can search for bank owned homes for sale as well as short properties using our real estate search tool: LowryTeam.com You can create your own search criteria, save your searches, get alerts of newly listed homes for sale and much more!

Beckett Ridge Community Garage Sale: The Beckett Ridge community garage sale is scheduled for Saturday, May 14th, 2011 from 8:00am – 4:00pm. The Beckett Ridge Homeowners Association will run ads in the local newspapers. You can find more information regarding the Beckett Ridge garage sale and the homeowners association on the Beckett Ridge Homeowners Association website: http://www.beckett-ridge.org/
![]() Our facebook fan page of the week is: West Chester Township It is a brand new page on Facebook for West Chester Township! You can find information on events and news going on in our township. As of this writing their page very few friends, so I ask that you visit their fan page, become a fan and invite your facebook friends to do the same.
Our facebook fan page of the week is: West Chester Township It is a brand new page on Facebook for West Chester Township! You can find information on events and news going on in our township. As of this writing their page very few friends, so I ask that you visit their fan page, become a fan and invite your facebook friends to do the same.
While you are on facebook checking out West Chester Township, please visit and become a fan of our facebook page: www.Facebook.com/LowryTeamRealEstate
What is my home worth? Want to get a good idea of what your home is worth… Get your own Personal Real Estate Market Update
Searching for homes for sale? Search all of the homes for sale in West Chester, Beckett Ridge, Liberty Township, Mason or Monroe Ohio… Search The MLS
LowryTeam.com: Monthly Real Estate Trends Report – March 2011
 Here is the newest edition of our LowryTeam.com Monthly Real Estate Trends Report for March 2011. This report, published monthly, provides a look back at the last six months worth of real estate data for West Chester, Beckett Ridge and Liberty Township, Ohio. It is a local trends report and makes no attempt to draw overall conclusions or make predictions for the larger real estate market. In fact we believe that anyone that makes an attempt to predict future, national real estate market conditions or draws conclusions on recent historical data nationally is just out of touch with reality. There is no such thing as a national weather forecast and there is no such thing as a real estate one either. ALL real estate is local!
The source of our data is the Greater Cincinnati Multiple Listing Service. By seeking out and understanding the trends in our market place we are better able to forecast the upcoming market conditions and counsel our clients on pricing strategies to get their home sold for the highest possible price. Any thoughts and insight into what may occur in the future are solely our opinions and forecasts.
The first thing we look at is unit sales for the last six months (September – February):
As mentioned in the February Real Estate Market Trends Report this most recent six months of data continues to reflect the decline in unit sales felt in the time immediately after the homebuyer tax credit expiration. The tax credit had the impact of drawing a lot of home sales into the first six months of last year and caused an extensive slow down afterward. The graph shows that the leveling off of home sales in West Chester and Liberty Township during this last six months time frame continued in February.
February 2011 homes sales showed a small uptick in sales when compared to the month of January 2011. February sales were however 9.38% lower than February of 2010. So the year over year comparison of sales does not look promising, particularly as we head into the next couple of months which will be compared to the “tax credit” months of last year.
The next few months represent very tough comparisons moving forward as we will be comparing sales levels this year against the sales levels of the months of last year when the tax credits for homebuying were in place. Generally we expect the year to year comparisons to be much lower than 2010 unless there is some unexpected development in the marketplace.
Average sale price for the last six months (September – February) is next:
In this graph you can see the movement of the average sale price for West Chester and Liberty Township, Ohio real estate sales from January 2010 through February of 2011. The trend line continues to show you a gradual decline for average home sale prices. Average sale price gets quite a bit of attention in the media with reports that quote “home prices fell” or “home prices rose” in this particular quarter or month or whatever. The average sale price is nothing more than what it’s called – an average price of all of the homes sold in a particular time frame.
Just to be clear here, homes are not worth more now than they were at the beginning of the year. Any increase or decrease in the average sale price is reflective of the activity of that time frame not the exact value of any one home. A perfect example of this is the month of January which according to the graph shows a huge decrease in the average sale price over the month of January 2010. A look inside the numbers explains… In January 2010, 8 of the total 42 closed sales that month were under $150,000 in sale price, in January 2011 there were 14 of a total 49 closed sales in that same price range. More sales in the lower price ranges will cause the average sale price to be lower. In addition, in January 2010 there were 6 closed sales over $400,000 compared to just 3 closed sales in January 2011 over $400,000. The luxury home market is facing a very difficult period in the next six months to a year with very high inventory levels and competition from the Homearama show homes.
So, was the average sale price lower because homes were worth less? No, there was just a very different mix of homes that sold. Falling home values do clearly effect the average sale price, but that is not the whole story.
List to sale price ratio:
The List to Sale Price ratio is calculated by dividing the final sale price into the list price to find the percentage of the list price that a given home sells for. The West Chester and Liberty Township Ohio List to Sale Price Ratio is 94.02% for February 2011. As you can see the monthly List to Sale Price Ratio has seen some big swings up and down in the last year and we took another big drop down in February. The swings up and down are an indicator of the lack of stability in the West Chester and Liberty Township real estate market right now. The highlighted center area of the graph shows what appears to be the middle ground right now for the market.
The trend here had been on an upswing, indicating that homeowners are generally pricing their homes at levels that reflect market value. One important fact to keep in mind here is that these figures are calculated based on homes that have sold. Homes that are priced too high when listed will not get 95-96% of their list price, in fact in this market, they won’t sell at all.
The one factor that remains true, through all of the market’s ups and downs is that homes that sell quickly, sell for a much higher percentage of their list price. In the most recent six months, homes that sold in the first thirty days that they were on the market sold for 96.75% of list price. As you can see, this is a much higher final sales price compared to the overall market average.
Summary:
As was stated in last month’s LowryTeam.com: West Chester, Beckett Ridge and Liberty Township real estate market update, our market remains challenging, yet full of opportunity. Clearly the value of homes in the area has fallen over the past couple of years and frankly, in certain price ranges, the values are likely to fall farther. The primary threats to the 2011 real estate market and any potential recovery are continued high unemployment and the potential loss of the mortgage interest tax deduction. Interest rates have now risen off of their lows, but still remain at very attractive levels below 5.00% which provide a great environment for buying a new home.
Your comments and questions are always welcome!
Search Homes For Sale In West Chester & Liberty Township Ohio
Wondering what your home is worth in today’s real estate market? Request a market analysis here!
posted by Eric Lowry
LowryTeam.com: Monthly Real Estate Trends Report – February 2011
Here is the newest edition of our LowryTeam.com Monthly Real Estate Trends Report for January 2011. This report, published monthly, provides a look back at the last six months worth of real estate data for West Chester, Beckett Ridge and Liberty Township, Ohio. It is a local trends report and makes no attempt to draw overall conclusions or make predictions for the larger real estate market. In fact we believe that anyone that makes an attempt to predict future, national real estate market conditions or draws conclusions on recent historical data nationally is just out of touch with reality. There is no such thing as a national weather forecast and there is no such thing as a real estate one either. ALL real estate is local!
The source of our data is the Greater Cincinnati Multiple Listing Service. By seeking out and understanding the trends in our market place we are better able to forecast the upcoming market conditions and counsel our clients on pricing strategies to get their home sold for the highest possible price. Any thoughts and insight into what may occur in the future are solely our opinions and forecasts.
We always look first at unit sales for the last six months (August – January):
As mentioned in the January Real Estate Market Trends Report this most recent six months of data continues to reflect the time immediately after the homebuyer tax credit expiration. As we discussed before there was a drop in sales in this period that was pretty dramatic. The tax credit had the impact of drawing a lot of home sales into the first six months of the year and causing an extensive slow down afterward. The graph shows that that there has been a leveling off of home sales in West Chester and Liberty Township during this last six months timeframe.
January 2011 homes sales showed a continued decline when compared to the month of December and overall as you look at the last six months sales activity. January sales were however 16.67% higher than January of 2010. So in a year over year comparison the sales may look a little more promising. It must be noted here that the sales figures in January 2010 were the lowest in West Chester & Liberty Township in at least the last five years, so this January’s sales are the second lowest in the last five years.
The next few months represent very tough comparisons moving forward as we will be comparing sales levels this year against the sales levels of the “Tax Credit” months of last year. Generally we expect the year to year comparisons to be much lower than 2010 unless there is some unexpected development in the marketplace.
Average sale price for the last six months (August – January) is next:
In this graph you can see the movement of the average sale price for West Chester and Liberty Township, Ohio real estate sales in 2010 and January of 2011. The trend line continues to show you a gradual decline for average home sale prices. Average sale price gets quite a bit of attention in the media with reports that quote “home prices fell” or “home prices rose” in this particular quarter or month or whatever. The average sale price is nothing more than what it’s called – an average price of all of the homes sold in a particular time frame.
Just to be clear here, homes are not worth more now than they were at the beginning of the year. Any increase or decrease in the average sale price is reflective of the activity of that time frame not the exact value of any one home. A perfect example of this is the month of January which according to the graph shows a huge decrease in the average sale price over the month of January 2010. A look inside the numbers explains… In January 2010, 8 of the total 42 closed sales that month were under $150,000 in sale price, in January 2011 there were 14 of a total 49 closed sales in that same price range. More sales in the lower price ranges will cause the average sale price to be lower. In addition, in January 2010 there were 6 closed sales over $400,000 compared to just 3 closed sales in January 2011 over $400,000. The luxury home market is facing a very difficult period in the next six months to a year with very high inventory levels and competition from the Homearama show homes.
So, was the average sale price lower because homes were worth less? No, there was just a very different mix of homes that sold. Falling home values do clearly effect the average sale price, but that is not the whole story.
List to sale price ratio:
The List to Sale Price ratio is calculated by dividing the final sale price into the list price to find the percentage of the list price that a given home sells for. The West Chester and Liberty Township Ohio List to Sale Price Ratio is 95.73% for January 2011. As you can see the monthly List to Sale Price Ratio has seen some big swings up and down in the last year. The swings up and down are an indicator of the lack of stability in the West Chester and Liberty Township real estate market right now. The highlighted center area of the graph shows what appears to be the middle ground right now for the market. The trend here is on an upswing, indicating that homeowners are generally pricing their homes at levels that reflect market value. One important fact to keep in mind here is that these figures are calculated based on homes that have sold. Homes that are priced to high when listed will not get 95-96% of their list price, in fact in this market, they won’t sell at all.
The one factor that remains true, through all of the market’s ups and downs is that homes that sell quickly, sell for a much higher percentage of their list price. In the most recent six months, homes that sold in the first thirty days that they were on the market sold for 96.76% of list price. As you can see, this is a much higher final sales price compared to the overall market average.
Summary:
As was stated in last month’s LowryTeam.com: West Chester, Beckett Ridge and Liberty Township real estate market update, the market remains challenging, yet full of opportunity. Clearly the value of homes in the area has fallen over the past couple of years and frankly, in certain price ranges, the values are likely to fall farther. The primary threats to the 2011 real estate market and any potential recovery are continued high unemployment and the potential loss of the mortgage interest tax deduction. Interest rates have now risen off of their lows, but still remain at very attractive levels below 5.00% which provide a great environment for buying a new home.
Your comments and questions are always welcome! Search Homes For Sale In West Chester & Liberty Township Ohio Wondering what your home is worth in today’s real estate market? Request a market analysis here!
LowryTeam.com: Monthly Real Estate Trends Report – January 2011
↑ Click the “Like” button ↑
Here is the newest edition of our LowryTeam.com Monthly Real Estate Trends Report for January 2011. This report, published monthly, provides a look back at the last six months worth of real estate data for West Chester, Beckett Ridge and Liberty Township, Ohio. It is a local trends report and makes no attempt to draw overall conclusions or make predictions for the larger real estate market. In fact we believe that anyone that makes an attempt to predict future, national real estate market conditions or draws conclusions on recent historical data nationally is just out of touch with reality. There is no such thing as a national weather forecast and there is no such thing as a real estate one either. ALL real estate is local!
The source of our data is the Greater Cincinnati Multiple Listing Service. By seeking out and understanding the trends in our market place we are better able to forecast the upcoming market conditions and counsel our clients on pricing strategies to get their home sold for the highest possible price. Any thoughts and insight into what may occur in the future are solely our opinions and forecasts.
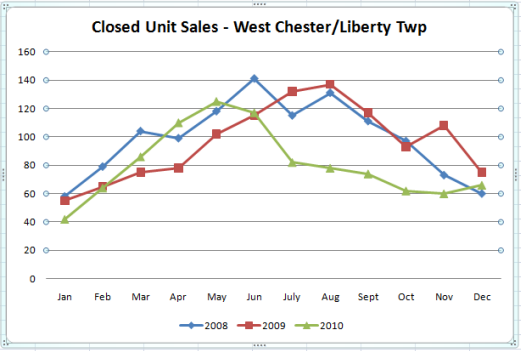
First we take a look at unit sales for the last six months (July – December):
This most recent six months of data reflect the time immediately after the home buyer tax credit expiration. As you can see the drop in sales in this period was pretty dramatic. The tax credit had the impact of drawing a lot of home sales into the first six months of the year and causing an extensive slow down afterward. The graph shows that that there has been a leveling off of home sales in West Chester and Liberty Township during this last six months time frame.
To put these levels of home sales in proper perspective we can also compare them to the same time periods of the last two years. In the fall of last year (2009) we had just seen the extension of the original first time homebuyer tax credit. In the fall of 2008 we were in the midst of the financial crisis with the all of the bank failures, etc. which caused a very significant slow down at the time in home sales. So when you compare the last three year’s home sales for this time period of July – December you can see that our current level of home sales had been tracking at a level that was below the levels seen during the financial crisis, but in December moved upward slightly, basically pulling even with December 2008 and down 13.16% compared to home sales in December 2009.
This continues to be a pretty amazing statistic when you consider that we are operating in an environment of both extremely low interest rates and home prices. One factor that may provide an uptick of some sort in home sales in the near term is rising interest rates. Rates have definitely risen off of their lowest levels and history tells us that when rates go up, they tend to go up fast. Some homebuyers may be fearful of missing out on these really low rates and will jump into the market to get a home under contract while the below 5.00% interest rates are still available. This could result in a small upward trend for home sales in the next few months over the current levels.
Average sale price for the last six months (July – December) is next:
In this graph you can see the movement of the average sale price for West Chester and Liberty Township, Ohio real estate sales in 2010. If you watch the trend line you can see a gradual decline for 2010. Average sale price gets quite a bit of attention in the media with reports that quote “home prices fell” or “home prices rose” in this particular quarter or month or whatever. The average sale price is nothing more than what it’s called – an average price of all of the homes sold in a particular time frame.
Homes are not worth more now than they were at the beginning of the year. Any increase or decrease in the average sale price is reflective of the activity of that time frame. A perfect example of this is the month of August which according to the graph shows a huge increase in the average sale price over the month of July. A look inside the numbers explains… In July, 17 of the total 82 closed sales that month were under $140,000 in sale price, in August there were only 6 of a total 78 closed sales in that same price range. Less sales in the lower price ranges will cause the average sale price to be higher. In addition, in July there were just 4 closed sales over $400,000 compared to 9 closed sales in August over $400,000. So, was the average sale price higher because homes were worth more? No, there was just a very different mix of homes that sold.
List to sale price ratio:
The List to Sale Price ratio is calculated by dividing the final sale price into the list price to find the percentage of the list price that a given home sells for. The West Chester and Liberty Township Ohio List to Sale Price Ratio is 95.68% for the six month period of July – December 2010. As you can see the monthly List to Sale Price Ratio has seen some big swings up and down in the last year. The swings up and down are an indicator of the lack of stability in the West Chester and Liberty Township real estate market right now. The highlighted center area of the graph shows what appears to be the middle ground right now for the market. The previous two months had been below this range, indicating that homeowners are accepting lower offers when compared to their list prices than had been the case in previous months. In December the list to sale price ratio for West Chester & Liberty Township move back up into the middle of the middle ground so to speak.
The one factor that remains true, through all of the market’s ups and downs is that homes that sell quickly, sell for a much higher percentage of their list price. In the most recent six months, homes that sold in the first thirty days that they were on the market sold for 97.35% of list price. As you can see, this is a much higher final sales price compared to the overall market average.
Summary:
As was stated in last month’s LowryTeam.com: West Chester, Beckett Ridge and Liberty Township real estate market update, the market remains challenging, yet full of opportunity. Clearly the value of homes in the area has fallen over the past couple of years and frankly, in certain price ranges, the values are likely to fall farther. The primary threats to the 2011 real estate market and any potential recovery are continued high unemployment and the potential loss of the mortgage interest tax deduction. Interest rates have now risen off of their lows, but still remain at very attractive levels below 5.00% which provide a great environment for buying a new home.
Your comments and questions are always welcome! Wondering what your home is worth in today’s real estate market? Request a market analysis here!
West Chester Ohio Real Estate: The Dangers Of Overpricing Your Home
Why overpricing your home can be very costly.
You will lose the excitement that a new on the market listing generates: Real estate agents are working with buyers who have seen the homes currently on the market for sale and are waiting for new homes to be listed for sale. Meaning, the most activity(showings) will take place in the first thirty days that your home is on the market. Your home will receive it’s highest offer during this time. After the initial period of being on the market, the only people that will look at your home will be new buyers coming into the real estate market that are looking for homes.
You can lose the most qualified prospects: Prospective home buyers won’t just “make an offer” because they probably won’t ever see your home. They will view the homes for sale that are priced within their price range, knowing that they cannot afford anything that is priced in the higher price ranges.
Overpricing helps sell other, more properly priced homes first: Your home may be used to demonstrate the good value of other properties. Your objective should be to enter the real estate market in a position that will attract prospective buyers, not drive them away. A classic example of this is a buyer looking at a number of homes in a row and the feedback received from the showing of your home was that your home was too small compared to the other homes. This means that the other homes priced similar to yours were larger and a better value.
Your home will become stale on the market: Prospective buyers will wonder why your home has been on the market so long, or if something is wrong with your home, even after you lower the price. You may even have to settle for less than the market value. A home takes on a reputation surprisingly fast, so don’t wear out your welcome on the market.
You will lose a strong negotiating position when your home is on the market for a long time, both financially and mentally: Prospective buyers will not “feel a sense of urgency” to make an offer on an overpriced property, and you may feel compelled to accept less when you finally do get an offer. Getting an offer on your home in the first thirty days on the market allows you to negotiate from a position of strength, getting an offer on day one hundred and forty on the market… not so much.
If you do get an offer, the contract may “fall thru” because of appraisal issues: The contract sale price must be justified to the lender through the process of the home being appraised. The buyer’s lender hires a third party (the licensed appraiser) to determine the market value of the home at the time of sale. If the appraisal does not “come in” at or above the contract sale price, the sale cannot proceed without an adjustment being made. The list price and sale price of your home, when listed for sale, must be justified with market sales data.
Wondering what your home is worth in today’s real estate market? Request a market analysis here!
Check Out My Feature Homes For Sale In West Chester, Fairfield and Liberty Township, Ohio
- « Previous Page
- 1
- …
- 4
- 5
- 6
- 7
- Next Page »